Generating graceful contour lines from high resolution DEMs
With the advent of Lidar technology and map agencies carrying out large scale surveys, the availability of high resolution DEMs has opened new possibilities for map makers.
Contour lines are a common method used to denote elevation on maps. A contour line joins points of equal elevation on the map, making visible landforms such as valleys and hills, and the steepness of the terrain.
In this article I will show a method for generating contours from a 2 meter resolution DEM for use in a large scale (1:12 500) topographic map.
Design principles for contour lines
Contours should be easily readable and blend harmoniously with other map elements, matching the overall generalization of the map[1]. The interval between contours should be chosen to depict the terrain in an intelligible way without overloading the map.
Contours must not appear with excessive noise, small forms should be suppressed. In flat areas, contours should be simplified to show the main characteristics of the terrain.
Area of study
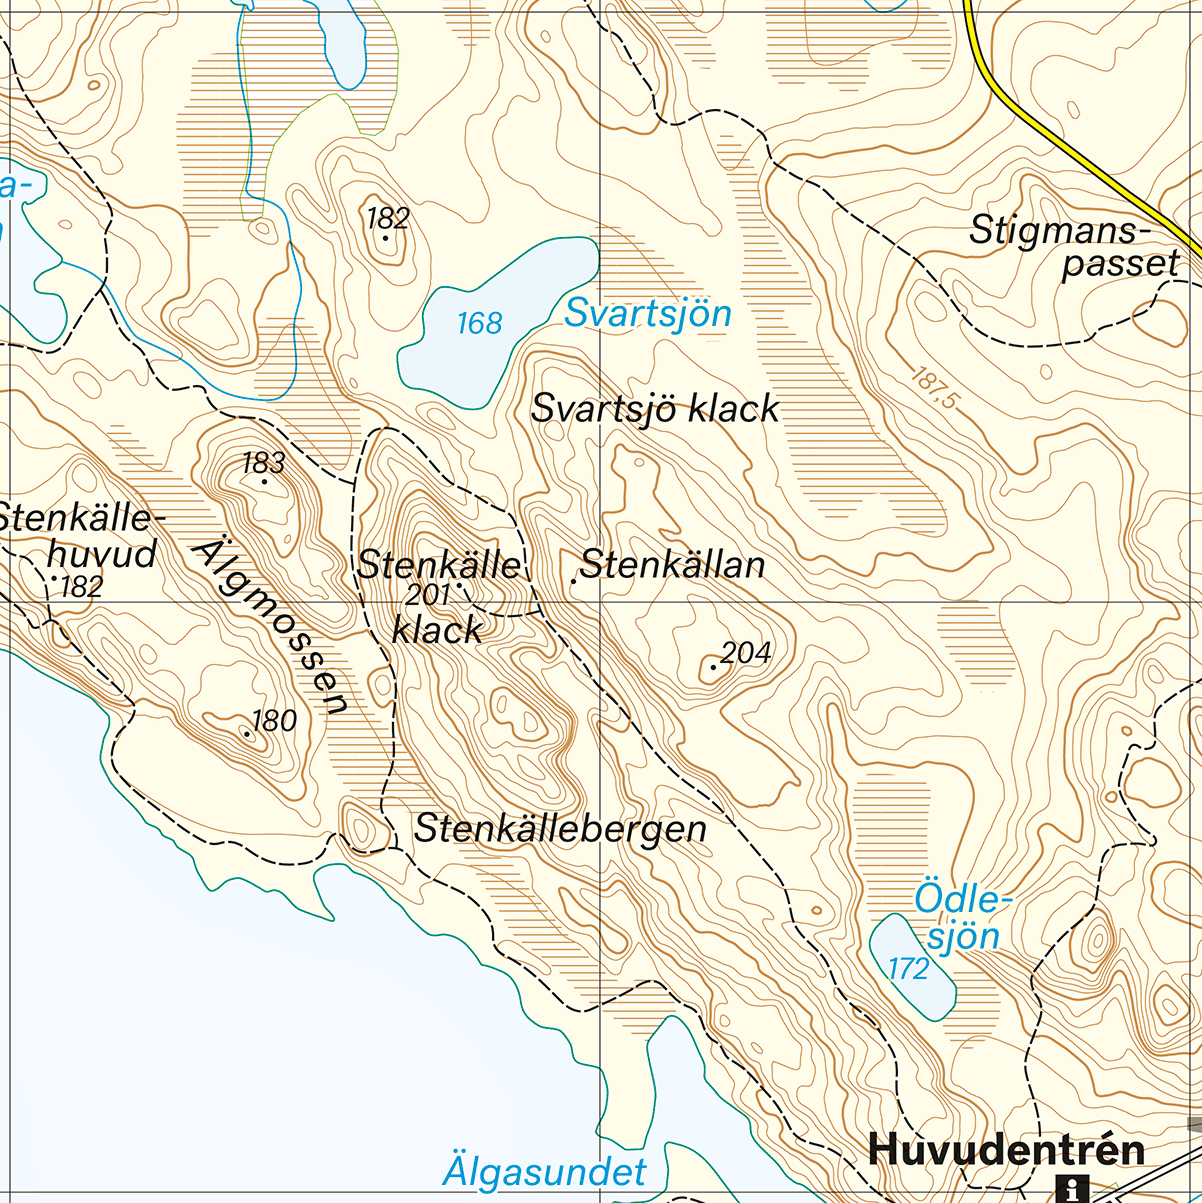
The area of study is a 1×1 km square in Tiveden National Park. Within this square we find both steep and gentle hills, as well as wetlands, typical for the area in general.
Update: I've made a script that automates this process, read more.
OK, let’s go ahead and make some contours. I chose a 2.5 m interval between contours and used QGIS to generate them. This was the result:
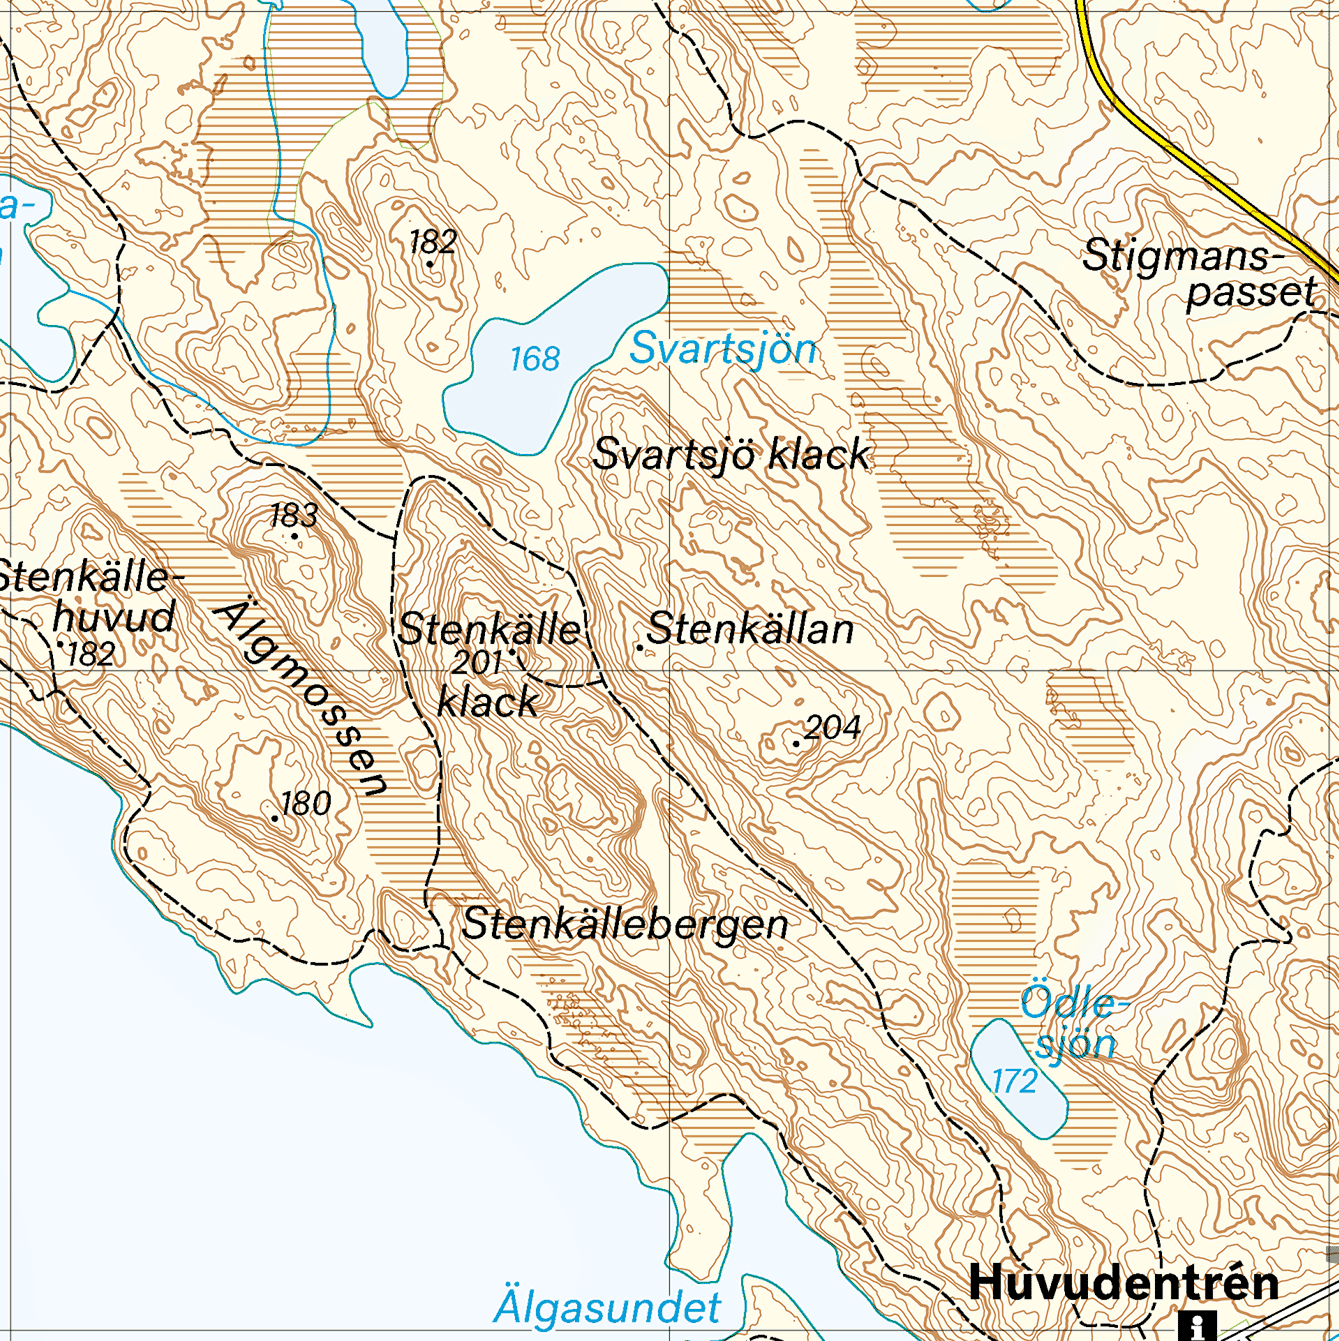
These contours are too noisy. Both the hills and especially the flat marshy areas contain inordinate detail which makes the map unpleasant to look at.
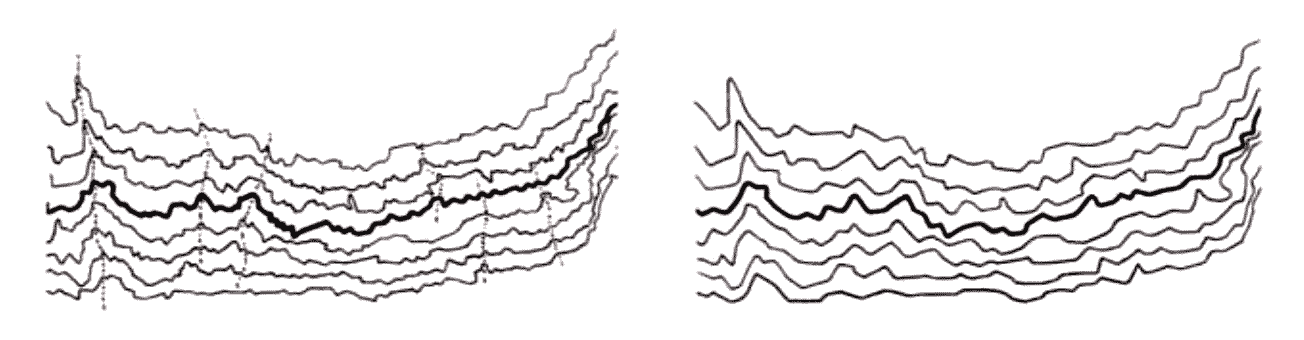
To smooth the contours we’re going to preprocess the DEM before generating new contours. Let’s try applying a Gaussian blur to it and see if that helps. This was done in Photoshop using a 1.6 px radius. Below are the resulting contours:
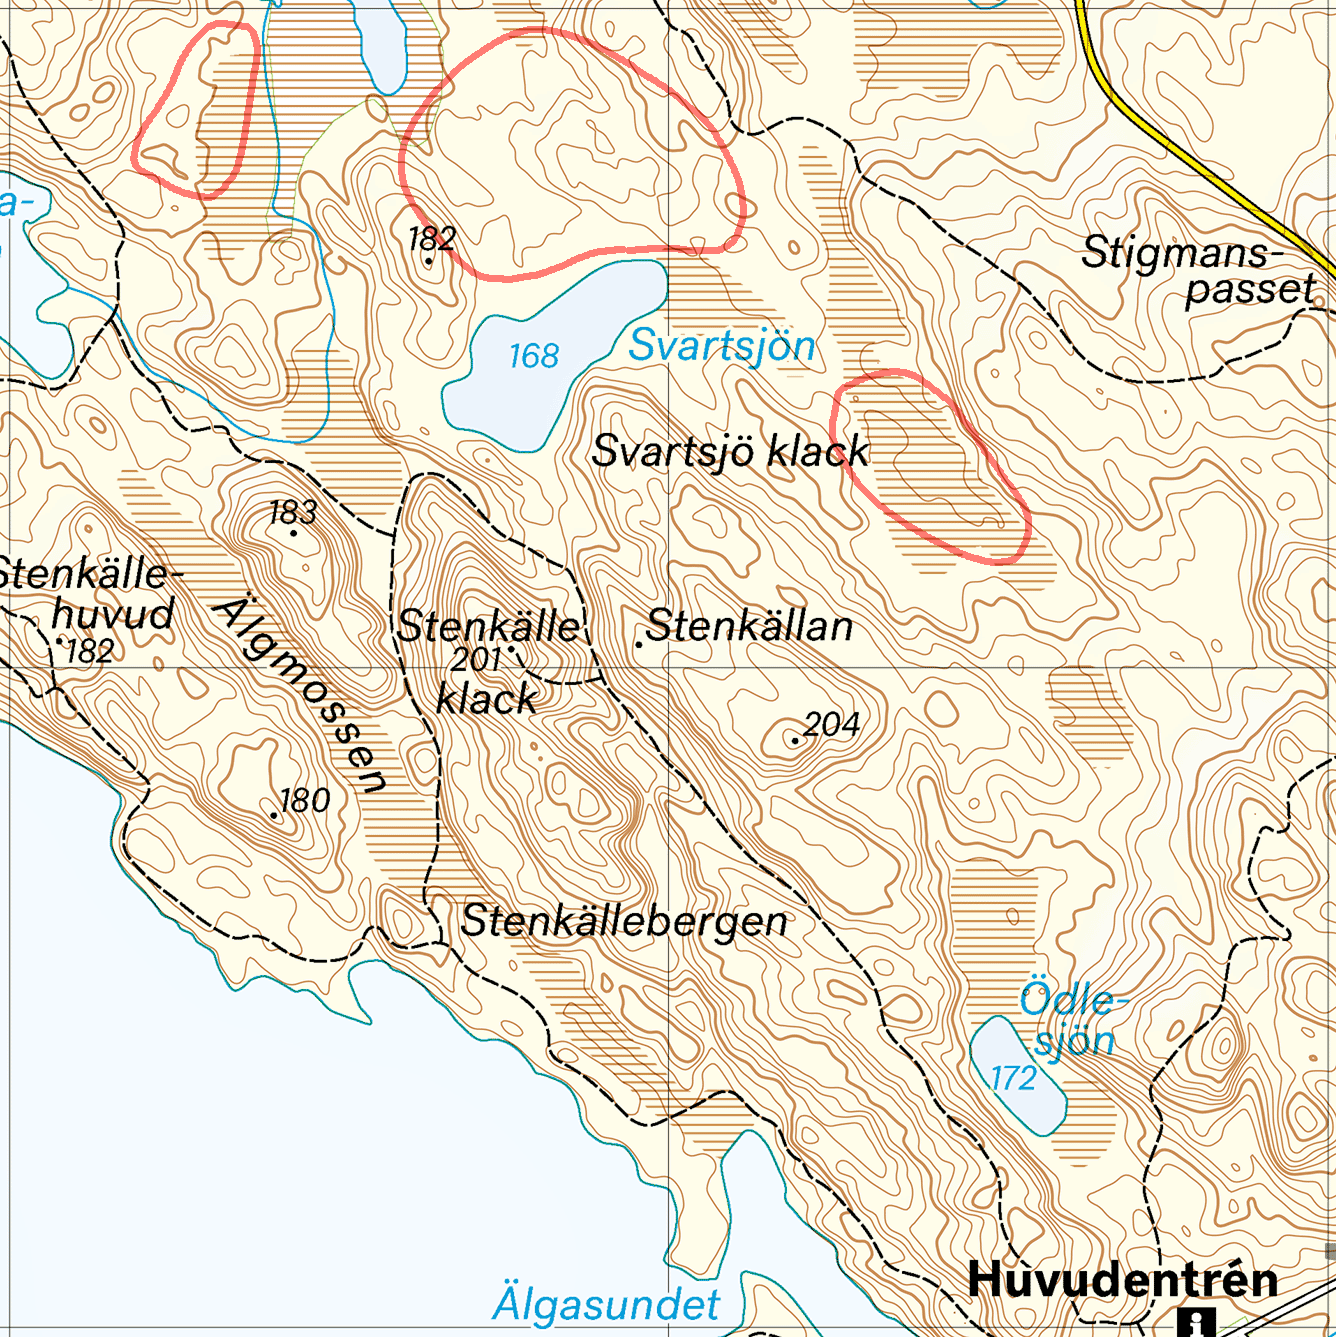
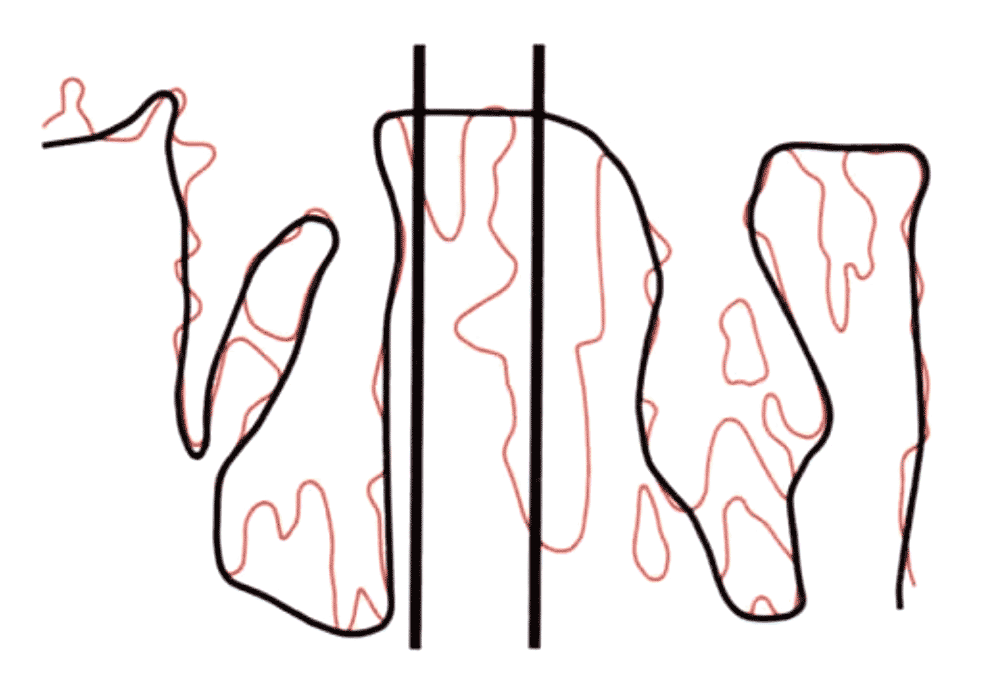
We’re making good progress. The hills and steeper areas are looking good, but there is still excessive detail in the flat areas, highlighted in red. What we need to do is apply more blur in flatter areas than we do in steeper areas. To achieve this I start by generating a slope map from the DEM. This is quickly done in QGIS. This slope map allows us to identify flat and steep areas, shown below.
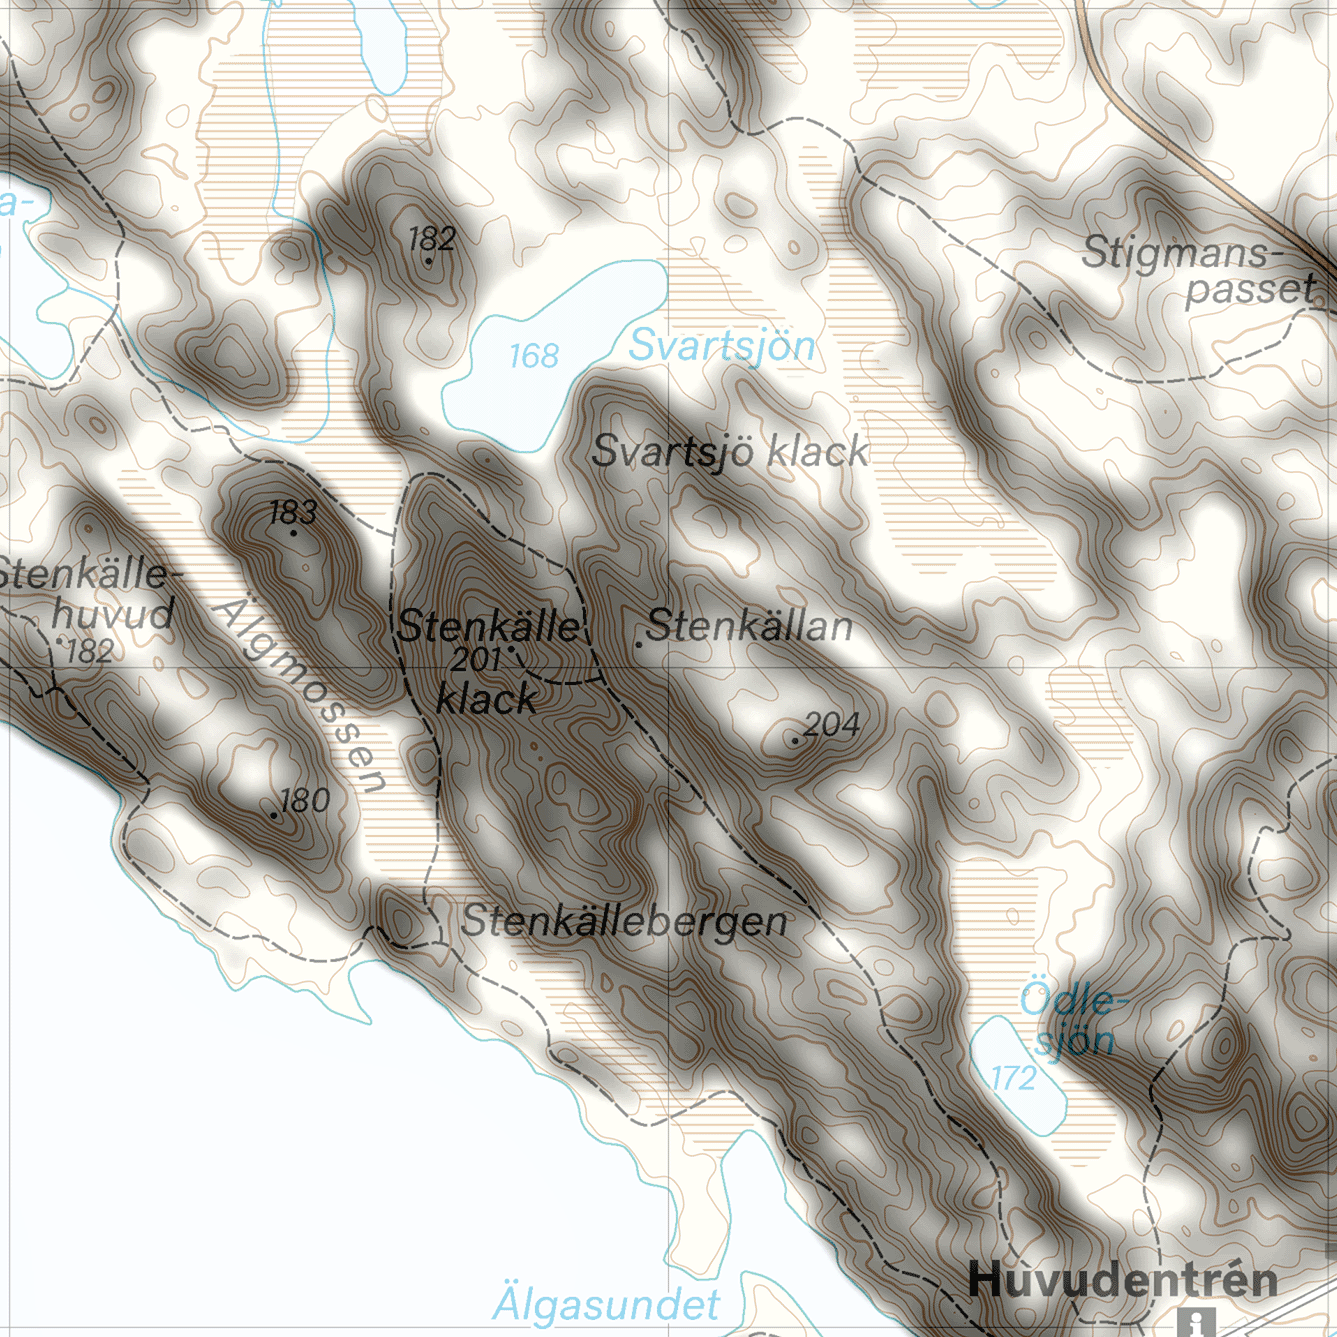
I proceed by making two versions of the DEM, one slightly blurred for steep areas and one with more blurring for flat areas. Using the slope map as a layer mask in Photoshop the two are merged into a composite.
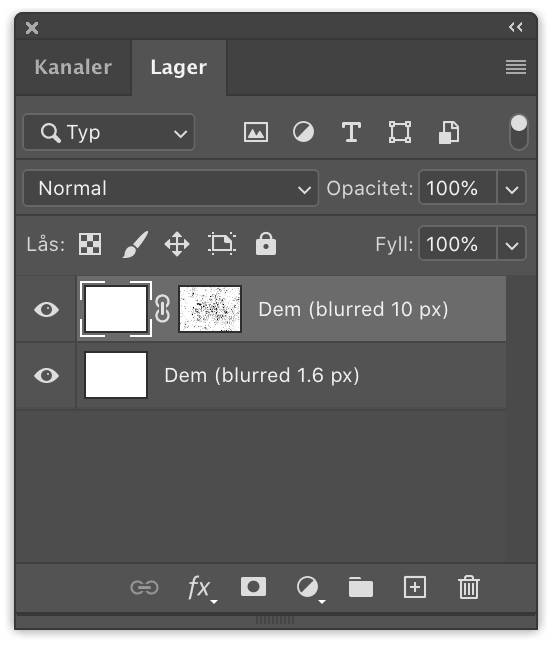
Now let us flatten the DEM composite before generating new contours:
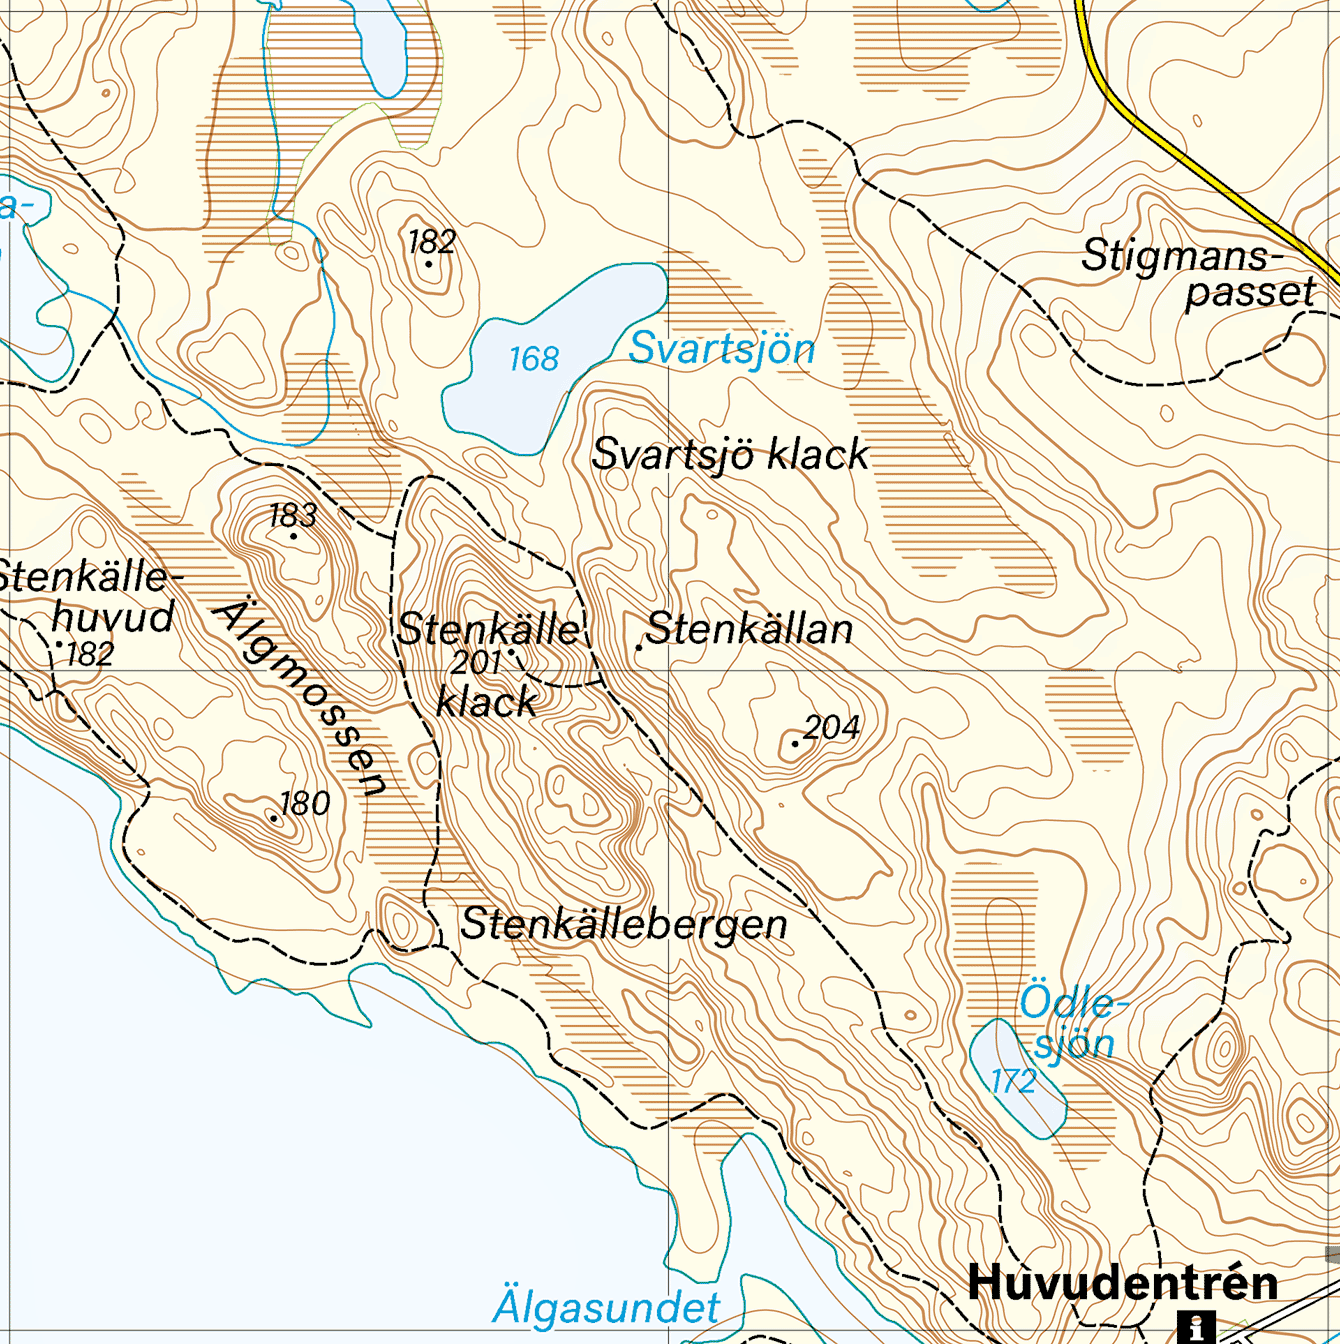
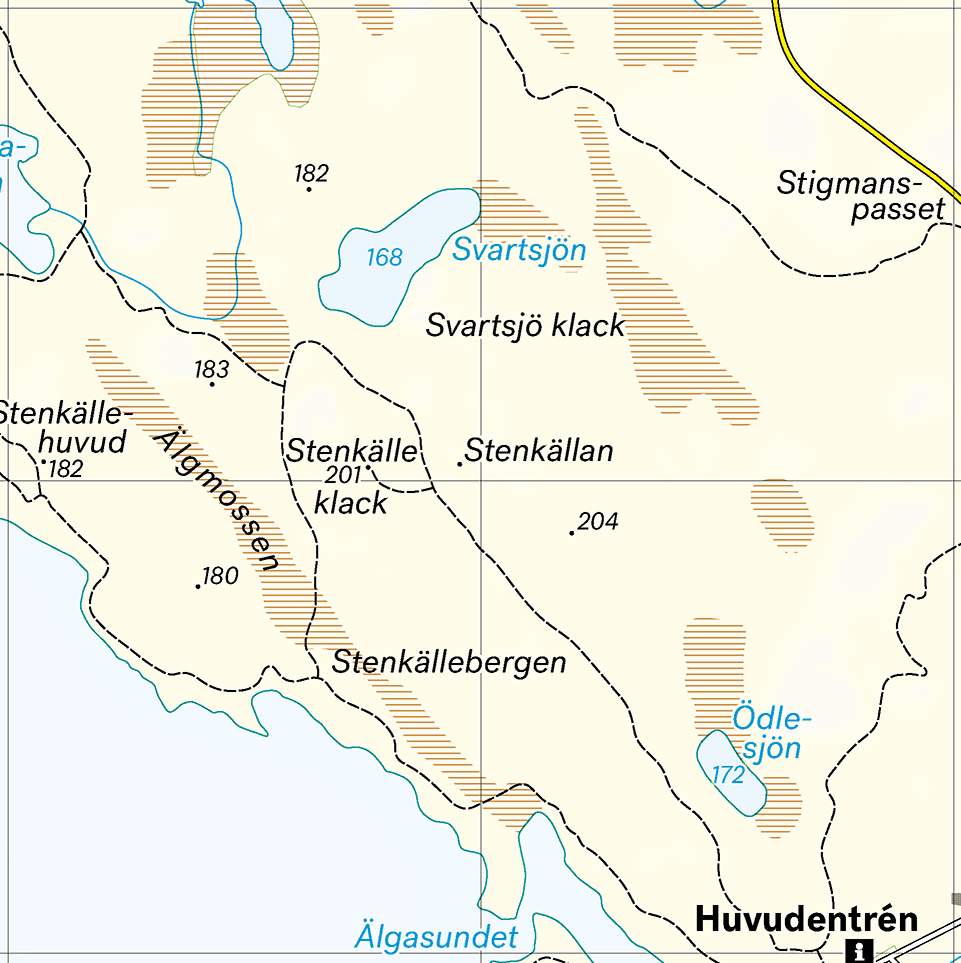
This looks pretty good, some manual cleanup is necessary but most of the contours have with a pleasing form and good level of generalization. Below is the final product after cleanup:
Discussion
Overall I’m pleased with the resulting contours. The process of finding the right blurring values was based on trial and error, and will depend on the terrain and target map scale. I noticed some artifacts where contours transition between flat and steep areas. This will require further investigation.
Some “medium flat” areas may have lost too much contour detail in my example, this could be corrected by adjusting the slope layer mask. I think the general idea of this method is sound and I will be using and fine-tuning it in upcoming projects.
■ November 6, 2020